IELTS Writing – Adult Education
IELTS WRITING TASK 1
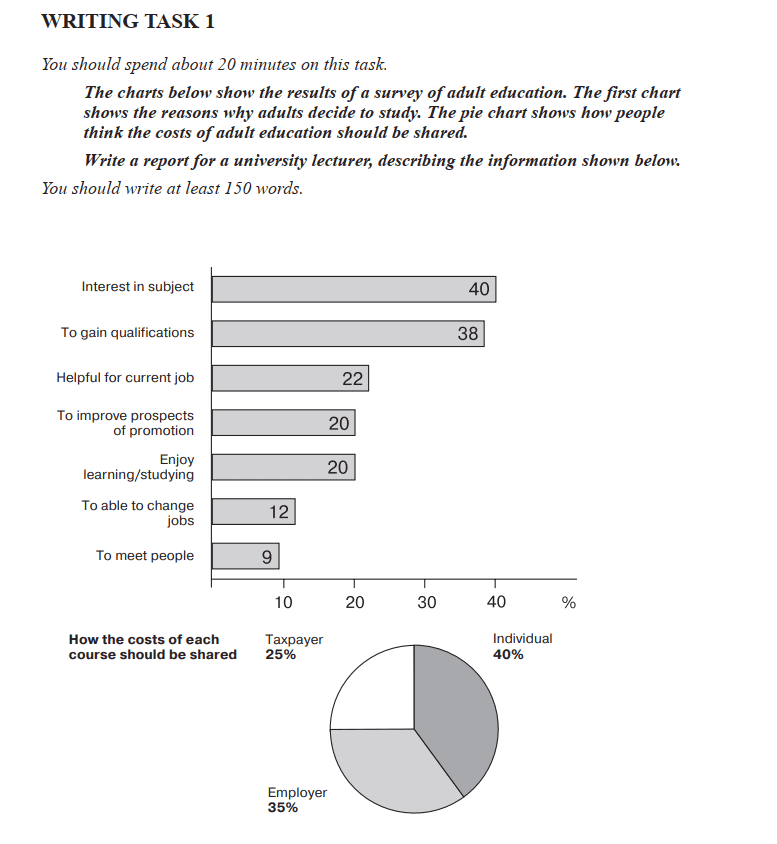
The charts below show the results ofa survey of adult education. The first chart shows the reasons why adults decide to study. The pie chart shows how people
think the costs of adult education should be shared. Write a report for a university lecturer, describing the information shown below.

Insight
The good thing about using multiple data is that it’s easy to assign a paragraph. If you look the motivation, you can simplify them into two groups: personal and work-related files.
Examine the data carefully. You should be able to impress by spotting details that are not immediately obvious. For example, you should be able to identify which subjects have the lowest and highest interest. To achieve a higher score, you need to demonstrate that you can find these subtleties.
Placing the overall summary at the end is acceptable but not the best approach. IELTS IDP suggests combining your introduction and overview into one paragraph for better coherence. This method helps the examiner or reader understand your ideas more easily. Remember this advice when writing your essay.
Avoid including any opinions in your writing, as IELTS focuses on the data presented. Opinions might affect your score negatively, so do not use words that imply opinions.
IELTS Writing – Adult Education – Version 01
The bar graph depicts the results of a survey on adult education, specifically focusing on the reasons or motivations behind their decision to study. Meanwhile, the pie chart illustrates the distribution of causes for each course. Overall, a significant portion of individuals pursue studies out of a genuine interest in the subject, and the primary source of funding comes from personal contributions.
The least common motivation for studying is to socialize, with approximately 9% of respondents choosing this option. Around 12% of participants decide to pursue education for a job change, while 22% aim to enhance their current employment. Both the prospects of promotion and the enjoyment of learning account for 20% each. Notably, the leading factor influencing the decision to study is the interest in the subject, comprising 40%. In which, a mere 2% difference from those aspiring to attain qualifications.
Examining the distribution of funding sources for various courses, it is observed that 40% of the budget is self-funded by individuals, with 35% being provided by employers. In contrast, a quarter of the remaining budget is shouldered by taxpayers.
IELTS Writing – Adult Education – Version 02
The bar graph illustrates survey results on adult education, focusing on factors influencing students’ decisions to pursue studies. The pie chart depicts the distribution of course costs. Overall, a significant portion of expenses will be covered individually, with the most prevalent motivation being a genuine interest in the subject.
The primary reason for these adults to pursue their education is the interest and subject, accounting for 40%, a 2% difference compared to gaining qualifications at 38%. Adult students who decided to continue their education to benefit from their current employment constitute 22%, while improving the prospect of promotion, and enjoying and learning while studying both stand at 20%. Only 12% of adults study to change their job, and the remaining 9% do so to meet people.
When it comes to the cost for each course, it is recorded that individuals will shoulder 40% of the overall expenditure, while 35% will be borne by employers. In contrast, the remaining 25% will be handled by taxpayers.
IELTS Writing – Adult Education – Version 03
The bar graph shows the results of a survey of working adults who want to pursue further education, while the pie chart illustrates how the costs of this education will be shared. Overall, although personal motivation is the highest factor, a significant number focus on job-related or career improvement, and three groups are responsible for the expenditure of this adult education.
Forty percent of survey participants said they want to pursue education because they are interested in the subject. Twenty percent indicated it is for their personal enjoyment of learning while the lowest reason, at 9%, is to network with different people. In comparison, 38% believe that pursuing education at their age will provide additional qualifications, 22% think it will improve their current job and 20% lead to a promotion, and 12% see it as an opportunity to change jobs.
Regarding the expenditure, it is expected that 40% of individuals will bear the financial responsibility, while more than a third (35%) of the cost will be covered by employers. The remaining percentage will be funded by taxpayers.
Check our partners at IELTS Rizz and Educatorian.
Check our other IELTS Writing
