IELTS Writing

IELTS Writing – Fast Food Consumption
IELTS WRITING TASK 1
You should spend about 20 minutes on this task.
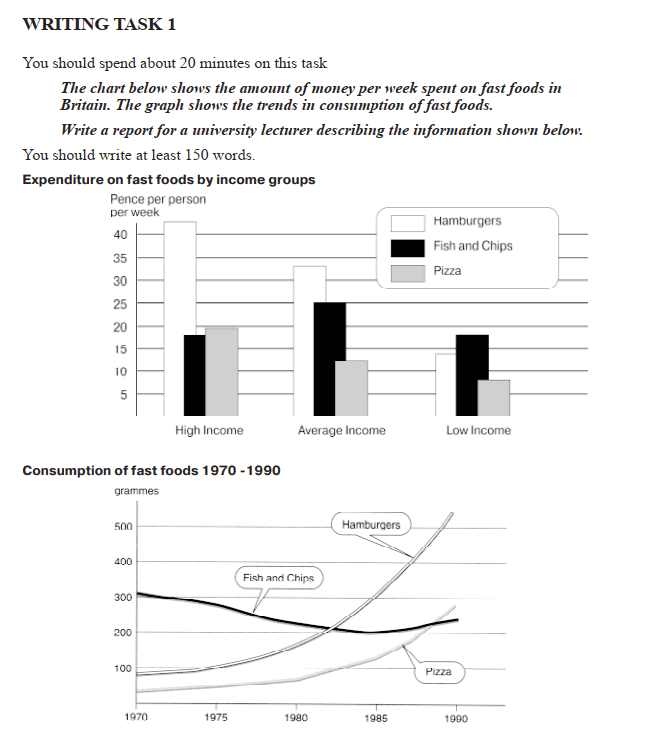
The chart below shows the amount of money per week spent on fast foods in Britain. The graph shows the trends in consumption of fast foods.
You should write at least 150 words.
Source: Cambridge 01 – Test 03 –

Pre-Writing Details
Data: Multiple (Bar graph and Line graph )
Time: 1970 – 1990 – Past tense
Paragraph 01: Introduction + Overview
Paragraph 02: Bar graph
Paragraph 03: Line graph
IELTS Writing – Fast Food Consumption – Version 01
The bar graph compares expenditure on fast food in Britain, categorized by different income brackets, while the line graph shows the consumption of specific fast foods from 1970 to 1990. Overall, fish and chips were popular among the low-income group and remained so until 1980.
For the low-income group, fish and chips had the highest expenditure, accounting for 17 pence per person per week, while pizza was only 8 pence per week. In contrast, hamburgers had the highest expenditure among high-income British people, at around 45 pence per week, while pizza and fish and chips were only 20 and 18 pence, respectively. Average-income consumers also had hamburgers as their highest expense at 33 pence, followed by fish and chips at 25 pence per week.
Regarding the consumption of fast food, fish and chips averaged the most in 1970 at 300 grams, while hamburgers were at 100 grams, and pizza was less than 40 grams. Over the next few years, hamburger consumption started to increase, while fish and chips began to decline. By 1982, both reached the same level at 200 grams. After this, hamburger consumption soared higher, reaching 500 grams in 1990, while fish and chips only reached 220 grams. Pizza, though the lowest initially, increased to nearly 300 grams.
Check our partners at IELTS Rizz and Educatorian.
Check our other IELTS Writing

IELTS Admin
0
Tags :