IELTS Writing – Weather Forecasts
IELTS WRITING TASK 1
You should spend about 20 minutes on this task.
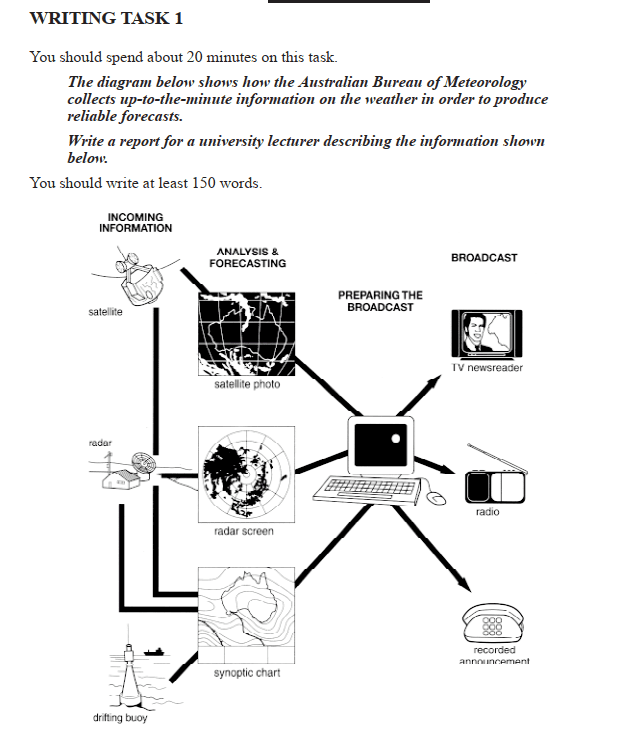
The diagram below shows how the Australian Bureau of Meteorology collects up-to-the-minute information on the weather in order to produce reliable forecasts.
Write a report for a university lecturer describing the information shown below.
You should write at least 150 words.
Source: Cambridge 01 – Test 02 –
IELTS Writing – Weather Forecasts – Version 01
The diagram illustrates the process of how the Australian Bureau of Meteorology collects optimal information on the weather to produce a reliable weather forecast. There are four major steps, from collating information to analysis, and finally, broadcasting.
Initially, the incoming information from the satellite is checked, and the satellite photo is transmitted to the radar station on Earth. The radar station generates a radar screen, and with the help of the drifting buoy, a synoptic chart is created. Once these three pieces of information are generated, they are ready for analysis and forecasting. After collating all this information, it enters the preparation stage for broadcasting.
In the preparation phase for broadcasting, the gathered information undergoes analysis. After verification, it proceeds to the last stage of broadcasting. The weather information is then delivered to TV news readers. For those without access to TV, the information can be accessed through radio or recorded announcements via telephone.
IELTS Writing – Weather Forecasts – Version 02
The process diagram illustrates how a reliable weather forecast is created by the Australian Bureau of Meteorology, ensuring the collation of up-to-the-minute information. There are three main instruments involved in gathering and forecasting, and the process involves four stages.
In the first stage, termed “incoming information,” the satellite, radar, and drifting buoy generate different data sent for preparation for broadcast. The satellite produces a photo image, communicating with the radar to create a radar screen. Additionally, the radar and drifting buoy collaborate to create a synoptic chart. Once these three components (satellite, radar and synoptic) are generated, they are input into a computer for further analysis.
The next stage is termed “preparing the broadcast,” where the three images are collated and subjected to further research. After verification, the process moves to the last stage, called “broadcast,” where the information is read by a news reader or broadcast via radio or recorded announcement.
IELTS Writing – Weather Forecasts – Version 03
The process diagram illustrates the detailed steps involved in obtaining a reliable weather forecast from the Australian Bureau of Meteorology and this forecast is then broadcast to the public. In
general, the process relies on three major pieces of equipment to create images that are analyzed and distributed across the continent.
To achieve a reliable analysis, three important types of images are required: satellite photos, radar screens, and synoptic charts. The satellite photo provides an aerial view of Australia, while radar
screens require both radar and satellite data. The synoptic chart is created using data from a drifting buoy and radar. These three images are forwarded to the analytics and forecasting team, where
they are combined into a coherent forecast.
Once collated, the data is further analyzed and stored on a computer. The forecast is then broadcast through three different mediums: television by news anchors, radio, and recorded announcements via telephone.
Check our partners at IELTS Rizz and Educatorian.
Check our other IELTS Writing