IELTS Writing – Annual Spending
/IELTS Writing Task 1 Academic – Annual Spending
Source: Cambridge IELTS 08 Test 02.
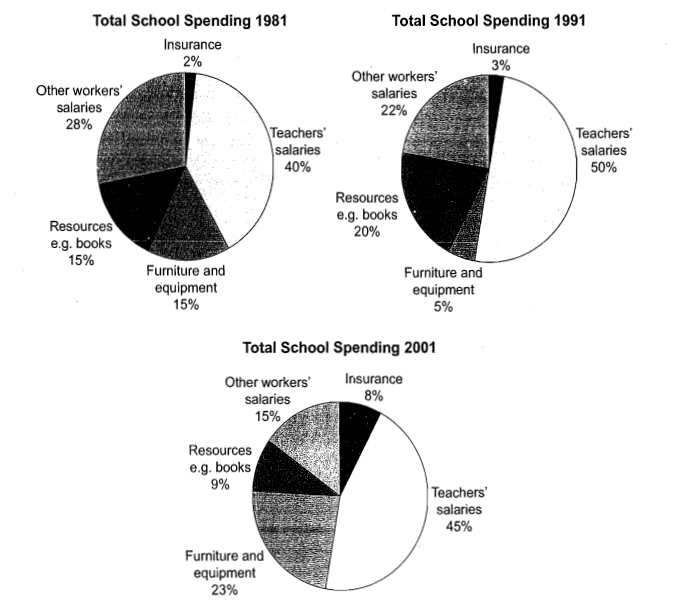
The three pie charts below show the changes in annual spending by a particular UK school in 1981, 1991 and 2001.
Summarise the information by selecting and reporting the main features, and make comparisons where relevant.Summarise the information by selecting and reporting the main features, and make comparisons where relevant. Write at least 150 words.
Write at least 150 words.
IELTS Writing Task 1 Academic – Annual Spending: Analysis
Data Type: Multiple Pie chart
Time: Past
Vocabulary
– Insurance – Premiums
– Teachers’ Salaries / Compensation /Remuneration /Pay
– Faculty / Teaching Staff /
– Other workers salaries / Non-faculty/ Non-teaching
IELTS Writing Task 1 Academic – Annual Spending Version 01.1
Paragraph 01: Introduction and Overview / Paragraph 02: 1981 / Paragraph 03: 2001
The three pie charts compare the annual spending of a particular school in the UK from 1981 to 2001, categorized by various expenditures. Overall, despite some decreases in the past two decades, teachers’ compensation remained the largest spending category, while premiums increased every decade.
In 1981, a combined 68% of the annual expenditure was allotted to the compensation of the school’s employees, with the most significant portion going to teachers’ salaries at 40%. By the next decade, this increased by 10%, while non-faculty members’ salaries decreased to 22%. Resources such as books, furniture, and equipment each accounted for 15%, totaling nearly a third of the school spending. The remaining amount was a small percentage allocated for insurance. In contrast, after ten years, spending on books increased to 20%, while furniture and equipment dropped to 5%.
In 2001, teachers’ remuneration experienced a slight decrease to 45%, while their non-teaching counterparts continued to decrease, constituting only 15% of the annual spending. The trends for books and furniture changed over the last decade; spending on books was halved, while nearly a quarter (23%) was allocated for furniture and equipment. Meanwhile, premiums grew to 8%.
(191 Words)
IELTS Writing Task 1 Academic – Annual Spending Version 01.2
Paragraph 01: Introduction and Overview / Paragraph 02: 1991 / Paragraph 03: 2001
The multiple pie charts compare the yearly spending of a certain school in the UK from 1981 to 2001. Overall, over two decades, expenditure on insurance increased, while spending on non-teaching staff continuously decreased.
In 1991, half of the school’s annual spending was allocated to teachers’ remuneration, a ten percent increase compared to 10 years ago. In contrast, compensation for non-faculty members decreased to 22%, a 6% decline. Only a fifth of the school’s expenditure was allocated to resources such as books, which was 5% higher. Spending on furniture and equipment decreased to 5%, in contrast to the previous decade, which was reduced to two-thirds.
In 2001, compensation for teaching staff fell to 45%, while non-faculty member compensation continued to decrease, reaching 15%. Spending on resources such as books and other miscellaneous items dropped to 9%, nearly a half decrease compared to the previous decade. Spending on furniture and equipment increased to nearly a quarter (23%), while insurance premiums constantly increased, reaching 8% in 2001. (165 Words)
IELTS Writing Task 1 Academic – Annual Spending Version 02
Paragraph 01: Introduction and Overview / Paragraph 02: Non-Teaching Staff, Insurance, Furniture / Paragraph 03: Resources and Teachers.
The multiple pie charts compare the yearly spending of a certain school in the UK from 1981 to 2001. Overall, over two decades, expenditure on insurance increased, while spending on non-teaching staff continuously decreased.
In 1981, more than a quarter (28%) of the school spending was allocated for non-faculty members. However, every decade it gradually decreased, reaching 15% by 2001, nearly halving. In contrast, premiums started at 2% in 1981 and gradually increased. By 2001, the school allocated 8% of its entire budget to this category. In 1991, furniture and equipment spending was only at 5%, a 10% difference compared to a decade earlier. The spending increased in the next decade, reaching 23%.
Both spending on resources such as books and teachers’ compensation followed the same trend. In 1991, there was an increase to 20% and 50%, representing an increase of 5% and 10%, respectively. However, after a decade, the spending dropped down to only 9%, almost cutting it in half, while teachers’ compensation dropped to 45%. (167 Words)
Check Educatorian and IELTS Rizz
Check Tasks 2