IELTS Writing – Goods Transported
IELTS Writing Task 1 Academic – Goods Transported
Source: Cambridge IELTS 08 Test 04.
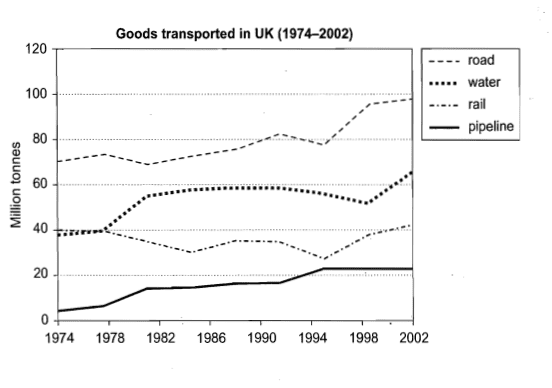
The graph below shows the quantities of goods transported in the UK between 1974 and 2002 by four different modes of transport.
Summarise the information by selecting and reporting the main features, and make comparisons where relevant. Write at least 150 words.
Write at least 150 words.
IELTS Writing Task 1 Academic – Goods Transported: Analysis
Line Graph
Time: Past
Vocabulary
– Quantities – the number / amount
○ Bulk, mass, amount, volume
○ Products , cargo, shipment
– Transported
– Road – land transport
– Water – maritime
– Rail – train, rail way
– Pipeline – tube
IELTS Writing Task 1 Academic – Goods Transported V.1
Paragraph 01: Introduction + Overview / Paragraph 02: Water and Rail / Paragraph 03: Road and Pipeline
The line graph compares the total amount of cargo delivered in the UK using different modes of transport from 1974 to 2002. Overall, despite some downward trends, land transport was the most utilized, while pipeline, though the least, managed to increase steadily.
Both maritime and rail managed to ship around 40 million tonnes of cargo to the UK from 1974 to 1978. However, after that, they parted ways. By 1982, water transported around 60 million tonnes, whereas rail dropped to 30 million tonnes the same year. Both modes of transport experienced a slight dip, but by 2002, they rose back to 60 million tonnes for water transport and 40 million tonnes for rail, respectively.
The largest cargo shipped to the UK was by means of land transport, accounting for 70 million tonnes in 1974, in contrast to the pipeline, which was only around 5 million tonnes. Although land transportation experienced some downward trends over the years, by 2002, it still remained the highest mode of delivery in the UK at around 100 million tonnes. Despite being in last place, pipeline transport had a steady increase until 1994 and remained at 20 million tonnes until 2002. 195 Words
IELTS Writing Task 1 Academic – Goods Transported V.2
Paragraph 01: Introduction + Overview / Paragraph 02: 1974 to 1986 / Paragraph 03: 1990 to 2002
The line graph compares the total amount of cargo delivered in the UK using different modes of transport from 1974 to 2002. Overall, with the exception of rail, all these modes of transport managed to increase steadily, despite some downward trends.
Transportation via the pipeline had the lowest amount of shipment in the UK in 1974, with only 5 million tonnes. However, it increased steadily and reached nearly 20 million in 1986, whereas rail fell from 40 million tonnes in 1974 to 30 million tonnes in 1986. Although the gap between land transportation and water was wide in 1974, at 70 million tonnes and 40 million tonnes, respectively, the gap closed due to the increase in water transport, reaching 60 million in 1986, with only a 10 million-tonne difference.
By 1990, railway transportation managed to maintain a steady number but fell nearly to 20 million, almost reaching the same level as the pipeline. However, rail bounced back, with 40 million tonnes of cargo shipped in the UK, while the pipeline reached a plateau of 20 million from 1994 to 2002. Between land and maritime transport, the gap widened as land transportation continued to accrue, reaching 100 million tonnes, the most utilized mode of transport in 2002, a 40 million-tonne difference from maritime transport. 213 Words
Check Educatorian and IELTS Rizz
Check Tasks 2