IELTS Writing

IELTS Writing – Land Degradation
IELTS Writing Task 1 Academic – Land Degradation
Source: Cambridge IELTS 08 Test 01.
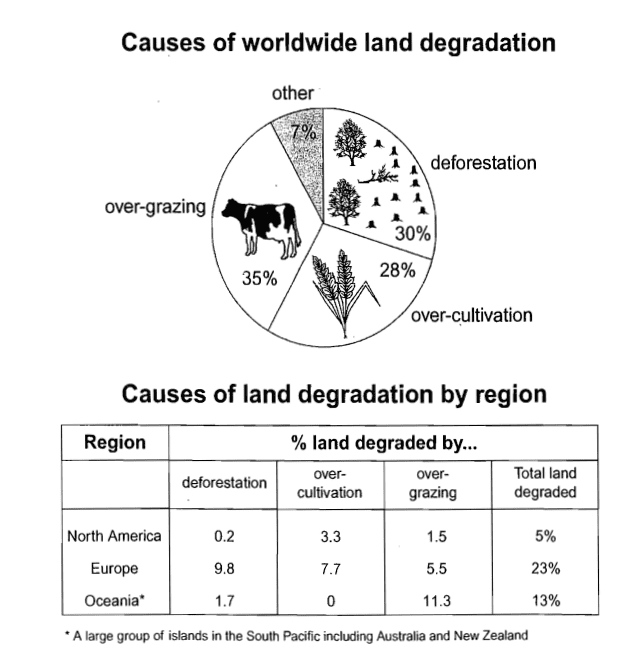
The pie chart below shows the main reasons why agricultural land becomes less productive. The table shows how these causes affected three regions of the world during the 1990s.
Summarise the information by selecting and reporting the main features, and make comparisons where relevant. Write at least 150 words.
Write at least 150 words.
IELTS Writing Task 1 Academic – Land Degradation: Analysis
Data: Pie Chart + Table
Time: Past
Vocabulary
1. World – worldwide, global
2. Over-grazing – over-pasturing
3. Deforestation – excessive / over-logging
4. Over-cultivation – excessive / over-farming
5. 28% – more than a quarter
6. 35% – more than a third
7. 30% – three-in-ten
Version 01
The pie chart compares the various causes of land degradation across the world, while the table shows the affected regions during the 1990s. Overall, over-utilization of land was the main cause of land degradation, with Europe being the region most heavily affected.
More than a quarter (28%) of the world’s land degradation was attributed to the over-cultivation of crops, while a third was caused by extensive logging. The biggest factor was over-grazing which accounted for more than a third (35%).
In terms of regions, North America had the lowest percentage with over-farming affected 3.3% of the land while over-pasturing impacted 1.5%, resulting in a total of 5% of all land being barren. Oceania had the highest percentage of infertile land impacted by over-grazing, totaling 11.3%. When factoring in deforestation, Oceania’s overall land degradation was 13%. In Europe, farmlands were heavily affected, with 23% of its overall land suffering from degradation. Deforestation was the biggest contributor, accounting for 9.8%, while over-cultivation and over-grazing accounted for 7.7% and 5.5%, respectively. (174 Words)
Version 02
The pie chart compares the leading causes of unproductive land due to soil degradation, while the table provides information on the percentage of affected land by region in the 1990s. Overall, over-usage of land was a significant factor contributing to unproductive land, with Europe’s farmland being the most heavily impacted compared to other regions.
More than a quarter (28%) of global land degradation was attributed to over-cultivation, with 7.7% of affected land found in Europe and 3.3% in North America. Overlogging accounted for 30% of land degradation worldwide, with only 1.7% of affected land in Oceania, a small fraction in North America, and 10% in Europe.
Over-grazing was responsible for more than a third (35%) of land degradation, with 10% of land in Oceania considered over-grazed, while 5% in Europe and 1.5% in North America. In total, nearly a quarter of European land was affected by land degradation, followed by Oceania at 13%. (157Words)
Check Educatorian and IELTS Rizz
Check Tasks 2

IELTS Admin
0
Tags :