IELTS Writing – UK Telephone Calls
IELTS Writing Task 1 Academic – UK Telephone Calls
Source: Cambridge IELTS 09 Test 02
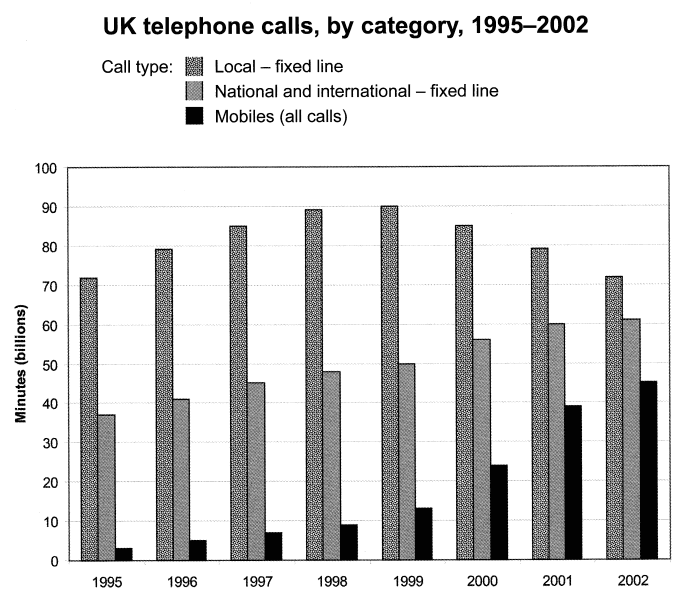
The chart below shows the total number of minutes (in billions) of telephone calls in the UK, divided into three categories, from 1995—2002.
Summarise the information by selecting and reporting the main features, and make comparisons where relevant. Write at least 150 words.
Write at least 150 words.
IELTS Writing Task 1 Academic – UK Telephone Calls: Analysis
Data Type: Bar Graph
Time: Past
Vocabulary:
Local Fixed Line / Local land line
National and International – fixed line –
Mobiles – cellular
IELTS Writing Task 1 Academic – UK Telephone Calls V1
Paragraph 01 – Introduction and Overview / Paragraph 02 – 1995 to 1999 / Paragraph 03 – 2000 to 2002
The bar graph compares the summation of call minutes in the UK in different categories from 1995 to 2002. Overall, despite a decrease in local landline usage, it was still the most utilized form of communication in the UK, and cellular calls increased dramatically.
In 1995, 70 million minutes of local fixed-line calls were made in the UK, while non-local fixed-line calls were about 38 million minutes, nearly half the difference. Meanwhile, there was a very small number of people in the UK utilizing mobile calls, at around 2.5 million minutes. After four years, local fixed-line accrued steadily, reaching nearly 90 million minutes, while its national and international counterparts increased to 50 million minutes.
By 2000, people in the UK started to utilize national and international landlines more, as the gap between them was getting closed. By 2002, the gap between the fixed landlines was only 10 million, and local fixed-line usage dropped to 60 million minutes. In contrast, cellular calls started to have a sharp rise in 2000, and by 2002, they reached 40 million but still remained in third place. (183 Words)
IELTS Writing Task 1 Academic – UK Telephone Calls V2
Paragraph 01 – Introduction and Overview / Paragraph 02 – Fixed Line (Local and Non-Local) /Paragraph 03 – Cellular
The bar graph compares the summation of call minutes in the UK in different categories from 1995 to 2002. Overall, despite a decrease in local landline usage, it was still the most utilized form of communication in the UK, and cellular calls increased dramatically.
Fixed landlines were the most utilized mode of telephone communication, with domestic calls recorded at 70 million in 1995. This continued to increase until it peaked at 90 million in 1999, whereas national and international fixed lines came second at 38 million in 1999, almost half of the fixed line. However, by 2000, local landline usage started to decrease, while its non-local line started to accrue, and by 2002, it reached 70 million and 60 million minutes, respectively. The gap came very close compared to nearly a decade ago.
Although mobile calls had the lowest usage throughout the nine-year data, it shows an upward increase. From 2.5 million minutes in 1999, it gradually increased, and by 2000, it started to skyrocket, reaching 40 million in 2002.
Check Educatorian and IELTS Rizz
Check Tasks 1